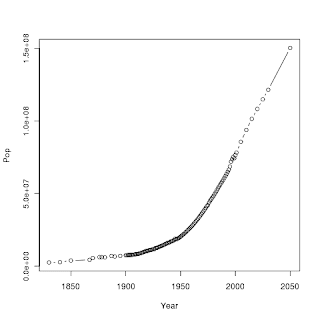
Here is a table suitable for free statistical and data analysis software R of the population of the Philippines. Data was obtained from a website "http://www.populstat.info/Asia/philippc.htm"
Year Pop
1830 2500000
1840 2675500
1850 3815900
1867 4319000
1870 5561200
1876 6173600
1878 6163600
1881 5985000
1887 6985100
1890 6621000
1895 7004000
1900 7409000
1901 7492000
1902 7577000
1903 7635400
1904 7659000
1905 7699000
1906 7761000
1907 7844000
1908 7964000
1909 8189800
1910 8220000
1911 8368400
1912 8576000
1913 8785000
1914 9016000
1915 9268000
1916 9542000
1917 9836000
1918 10314300
1919 10324000
1920 10445000
1921 10821900
1922 10991100
1923 11152000
1924 11405000
1925 11665000
1926 11583000
1927 12353900
1928 12498000
1929 12792000
1930 13094000
1931 13405000
1932 13724000
1933 14051000
1934 14387000
1935 14731000
1936 15084000
1937 15445000
1938 15984200
1939 16000300
1940 16356000
1941 16952000
1942 17039000
1943 17419000
1944 17757000
1945 18846800
1946 18434000
1947 18762000
1948 19144000
1949 19674000
1950 20275000
1951 20894000
1952 21533000
1953 22191000
1954 22869000
1955 23568000
1956 24288000
1957 25030000
1958 25795000
1959 26584000
1960 27377000
1961 28214000
1962 29064000
1963 29939000
1964 30841000
1965 31770000
1966 32727000
1967 33713000
1968 34728000
1969 35774000
1970 36852000
1971 37902000
1972 38991000
1973 40123000
1974 41297000
1975 42071000
1976 43751000
1977 45081000
1978 46113000
1979 47185000
1980 48317000
1981 49522000
1982 50791000
1983 52097000
1984 53398000
1985 54668000
1986 55895000
1987 57091000
1988 58282000
1989 59502000
1990 60779000
1991 62119000
1992 63512000
1993 64943000
1994 66391000
1995 68595000
1996 71899000
1997 73527000
1998 75174000
1999 74259000
2000 76498700
2001 78182000
2005 85599000
2010 93774000
2015 101404000
2020 108236000
2025 114842000
2030 121448000
2050 150272000
can easily plot this data via the command plot(D,type = "b"). This command will plot the points as circles and connect each successive points by a line.
The circles indicate data points. If you want a line type, without the circles, we can issue instead in the command line plot(D,type="l"). Notice the exponential form of the data especially in the middle portion. Now let us try something different. plot(D $ Year, log(D $ Pop), type="b")

This almost straighten the population curve.
I am having problem with putting a dollar sign inside a "&< tt &>" block.

No comments:
Post a Comment